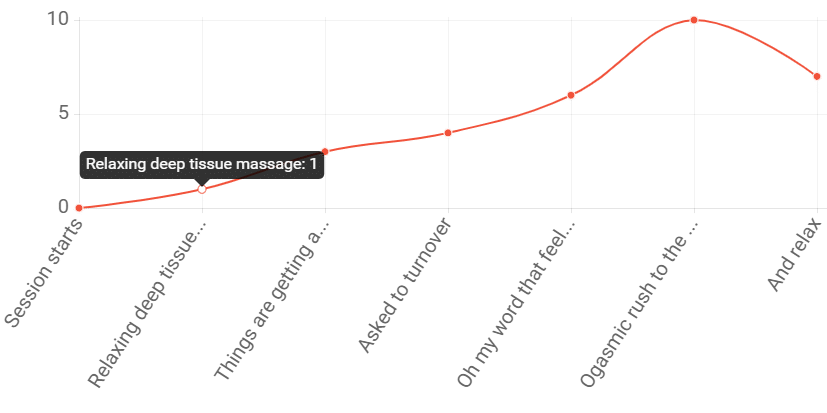
We have tried to explain the joys of a tantric massage using a simple line chart - see below.
The left axis represents pleasure, with 10 being the highest pleasure a human can possibly receive (imagine having an orgasm while eating chocolate, while taking heroin, while watching England win the world cup all at the same time).
The right axis shows what is happening during the different stages of the massage.
From the chart you can see as the session progresses the enjoyment levels keep rising until hitting the maximum 10 level.
This is where things crescendo into a blissful climax before slowly drifting back down to around 7 (usually accompanied with a head massage).
We are no statisticians but we are pretty sure this chart is fairly accurate.